Analytics: your numbers
Open the Analytics tab. This is your venue's own performance: bookings, revenue, guests, and when demand actually happens.
- Date ranges: last 7 / 30 / 90 days, plus This month and Last month for clean calendar-month comparisons (that is what your rent and P&L use, after all).
- Demand Heatmap: day-of-week × hour grid of where bookings concentrate. This is the map for happy-hour windows, so discount the cold cells and protect the hot ones.
- Abandoned (unpaid) checkouts are excluded everywhere, so numbers reflect real business.
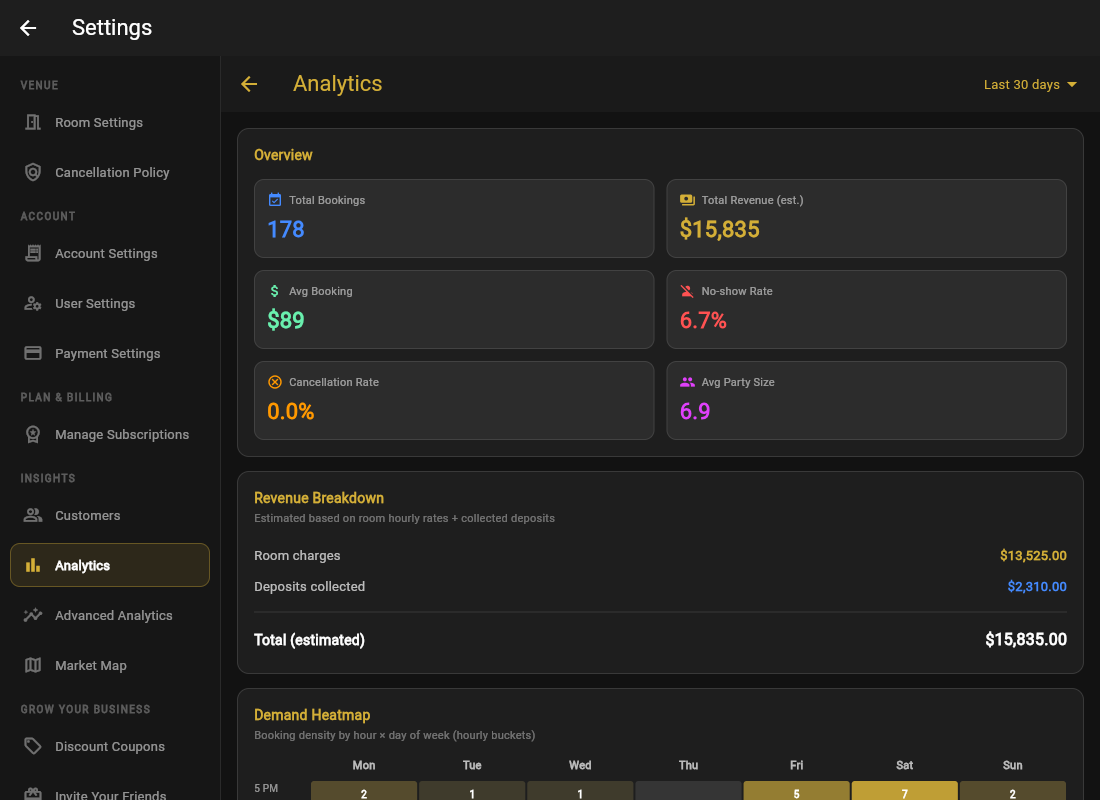
Monthly ritual, five minutes: last month vs the month before, on bookings, revenue, and no-shows. Three numbers, once a month, beats a dashboard you never open.